Web UI
Apache Spark 提供了一套 Web 用户界面 (UI),可用于监控 Spark 集群的状态和资源消耗。
目录
- Jobs 选项卡
- Stages 选项卡
- Storage 选项卡
- Environment 选项卡
- Executors 选项卡
- SQL 选项卡
- Structured Streaming 选项卡
- Streaming (DStreams) 选项卡
- JDBC/ODBC Server 选项卡
Jobs 选项卡
Jobs 选项卡显示 Spark 应用程序中所有作业的摘要页面以及每个作业的详细信息页面。 摘要页面显示高级信息,例如所有作业的状态、持续时间和进度以及整体事件时间线。 单击摘要页面上的作业时,您会看到该作业的详细信息页面。 详细信息页面进一步显示事件时间线、DAG 可视化以及作业的所有阶段。
此部分中显示的信息是
- User: 当前 Spark 用户
- Total uptime: Spark 应用程序启动以来的时间
- Scheduling mode: 请参见 任务调度
- Number of jobs per status: Active, Completed, Failed

- Event timeline: 按时间顺序显示与 executors(已添加、已删除)和 jobs 相关的事件

- Details of jobs grouped by status: 显示 jobs 的详细信息,包括 Job ID、描述(带有指向详细 job 页面的链接)、提交时间、持续时间、stages 摘要和 tasks 进度条

单击特定作业时,您可以看到该作业的详细信息。
Jobs 详情
此页面显示由其作业 ID 标识的特定作业的详细信息。
- Job Status: (running, succeeded, failed)
- Number of stages per status (active, pending, completed, skipped, failed)
- Associated SQL Query: 此作业的 SQL 选项卡的链接
- Event timeline: 按时间顺序显示与 executors(已添加、已删除)和作业的 stages 相关的事件

- DAG visualization: 此作业的 directed acyclic graph 的可视化表示,其中顶点表示 RDD 或 DataFrame,边表示要应用于 RDD 的操作。
- DAG 可视化的示例,例如
sc.parallelize(1 to 100).toDF.count()

- List of stages (grouped by state active, pending, completed, skipped, and failed)
- Stage ID
- Description of the stage
- Submitted timestamp
- Duration of the stage
- Tasks progress bar
- Input: 在此 stage 中从存储读取的字节数
- Output: 在此 stage 中写入存储的字节数
- Shuffle read: 读取的总 shuffle 字节数和记录数,包括本地读取的数据和从远程 executors 读取的数据
- Shuffle write: 写入磁盘的字节数和记录数,以便在将来的 stage 中通过 shuffle 读取

Stages 选项卡
Stages 选项卡显示一个摘要页面,其中显示 Spark 应用程序中所有作业的所有 stage 的当前状态。
页面开头是摘要,其中包含按状态(active、pending、completed、skipped 和 failed)统计的所有 stage 计数

在 Fair scheduling mode 中,有一个表格显示 pools properties

之后是每个状态(active、pending、completed、skipped、failed)的 stage 详细信息。在 active 的 stage 中,可以使用 kill 链接终止 stage。 仅在 failed 的 stage 中,才会显示失败原因。 单击描述可以访问任务详细信息。

Stage 详情
stage 详细信息页面以跨所有任务的总时间等信息开始,Locality level summary、Shuffle Read Size / Records 和 Associated Job IDs。

还有该 stage 的 directed acyclic graph (DAG) 的可视化表示,其中顶点表示 RDD 或 DataFrame,边表示要应用的操作。 节点按 DAG 可视化中的操作范围分组,并用操作范围名称(BatchScan、WholeStageCodegen、Exchange 等)标记。 值得注意的是,Whole Stage Code Generation 操作也使用代码生成 id 进行注释。 对于属于 Spark DataFrame 或 SQL 执行的 stage,这允许将 Stage 执行详细信息与 Web-UI SQL 选项卡页面中报告的 SQL 计划图和执行计划中的相关详细信息进行交叉引用。

所有任务的摘要指标都以表格和时间线显示。
- Tasks deserialization time
- Duration of tasks.
- GC time 是 JVM 垃圾回收的总时间。
- Result serialization time 是在 executor 上序列化任务结果,然后将其发回驱动程序所花费的时间。
- Getting result time 是驱动程序从 workers 获取任务结果所花费的时间。
- Scheduler delay 是任务等待被调度执行的时间。
- Peak execution memory 是 shuffle、聚合和连接期间创建的内部数据结构使用的最大内存。
- Shuffle Read Size / Records. 读取的总 shuffle 字节数,包括本地读取的数据和从远程 executors 读取的数据。
- Shuffle Read Fetch Wait Time 是任务花费在阻塞等待从远程计算机读取 shuffle 数据的时间。
- Shuffle Remote Reads 是从远程 executors 读取的总 shuffle 字节数。
- Shuffle Write Time 是任务花费在写入 shuffle 数据的时间。
- Shuffle spill (memory) 是 shuffle 数据的反序列化形式在内存中的大小。
- Shuffle spill (disk) 是数据在磁盘上的序列化形式的大小。

Aggregated metrics by executor 显示按 executor 聚合的相同信息。

Accumulators 是一种共享变量。它提供了一个可变变量,可以在各种转换中更新。 可以创建具有和不具有名称的累加器,但仅显示命名的累加器。

Tasks 详细信息基本上包括与摘要部分相同的信息,但按任务详细说明。 它还包括指向查看日志的链接以及任务尝试次数(如果因任何原因而失败)。 如果有命名的累加器,则可以在每个任务结束时看到累加器值。

Storage 选项卡
Storage 选项卡显示应用程序中持久化的 RDD 和 DataFrame(如果有)。 摘要页面显示所有 RDD 的存储级别、大小和分区,详细信息页面显示 RDD 或 DataFrame 中所有分区的大小和使用的 executors。
scala> import org.apache.spark.storage.StorageLevel._
import org.apache.spark.storage.StorageLevel._

scala> val rdd = sc.range(0, 100, 1, 5).setName("rdd")
rdd: org.apache.spark.rdd.RDD[Long] = rdd MapPartitionsRDD[1] at range at <console>:27

scala> rdd.persist(MEMORY_ONLY_SER)
res0: rdd.type = rdd MapPartitionsRDD[1] at range at <console>:27

scala> rdd.count
res1: Long = 100

scala> val df = Seq((1, "andy"), (2, "bob"), (2, "andy")).toDF("count", "name")
df: org.apache.spark.sql.DataFrame = [count: int, name: string]

scala> df.persist(DISK_ONLY)
res2: df.type = [count: int, name: string]

scala> df.count
res3: Long = 3

运行上述示例后,我们可以在 Storage 选项卡中找到两个 RDD。 提供了存储级别、分区数和内存开销等基本信息。 请注意,新持久化的 RDD 或 DataFrame 在具体化之前不会显示在该选项卡中。 要监控特定的 RDD 或 DataFrame,请确保已触发操作。

您可以单击 RDD 名称“rdd”以获取数据持久性的详细信息,例如集群上的数据分布。
Environment 选项卡
Environment 选项卡显示不同环境和配置变量的值,包括 JVM、Spark 和系统属性。

此环境页面包含五个部分。 它是检查您的属性是否已正确设置的有用场所。 第一部分“Runtime Information”仅包含 运行时属性,例如 Java 和 Scala 的版本。 第二部分“Spark Properties”列出了 应用程序属性,例如 ‘spark.app.name’ 和 ‘spark.driver.memory’。

单击“Hadoop Properties”链接将显示与 Hadoop 和 YARN 相关的属性。 请注意,诸如 ‘spark.hadoop.*’ 之类的属性不在此部分中显示,而是在“Spark Properties”中显示。

“System Properties”显示有关 JVM 的更多详细信息。

最后一部分“Classpath Entries”列出了从不同来源加载的类,这对于解决类冲突非常有用。
Executors 选项卡
Executors 选项卡显示有关为应用程序创建的 executors 的摘要信息,包括内存和磁盘使用情况以及任务和 shuffle 信息。 Storage Memory 列显示用于缓存数据的内存量和保留的内存量。

Executors 选项卡不仅提供资源信息(每个 executor 使用的内存量、磁盘量和核心数),还提供性能信息(GC time 和 shuffle 信息)。

点击执行器 0 的 ‘stderr’ 链接,将在其控制台中显示详细的标准错误日志。

点击执行器 0 的 ‘Thread Dump’ 链接,将显示执行器 0 上 JVM 的线程转储,这对于性能分析非常有用。
SQL 选项卡
如果应用程序执行 Spark SQL 查询,则 SQL 选项卡将显示有关查询的信息,例如持续时间、作业以及物理和逻辑计划。 在这里,我们包含一个基本示例来说明此选项卡
scala> val df = Seq((1, "andy"), (2, "bob"), (2, "andy")).toDF("count", "name")
df: org.apache.spark.sql.DataFrame = [count: int, name: string]

scala> df.count
res0: Long = 3

scala> df.createGlobalTempView("df")

scala> spark.sql("select name,sum(count) from global_temp.df group by name").show
+----+----------+
|name|sum(count)|
+----+----------+
|andy|         3|
| bob|         2|
+----+----------+

现在,以上三个 dataframe/SQL 运算符将显示在列表中。 如果我们点击最后一个查询的 ‘show at <console>: 24’ 链接,我们将看到查询执行的 DAG 和详细信息。

查询详细信息页面显示有关查询执行时间、持续时间、关联作业列表以及查询执行 DAG 的信息。 第一个块 ‘WholeStageCodegen (1)’ 将多个运算符(‘LocalTableScan’ 和 ‘HashAggregate’)编译成单个 Java 函数,以提高性能,并且诸如行数和溢出大小之类的指标都列在该块中。 块名称中的注释 ‘(1)’ 是代码生成 ID。 第二个块 ‘Exchange’ 显示 shuffle 交换的指标,包括写入的 shuffle 记录数、总数据大小等。

点击底部的 ‘Details’ 链接将显示逻辑计划和物理计划,它们说明了 Spark 如何解析、分析、优化和执行查询。 物理计划中受整体阶段代码生成优化影响的步骤,以星号开头,后跟代码生成 ID,例如 ‘*(1) LocalTableScan’
SQL 指标
SQL 运算符的指标显示在物理运算符的块中。 当我们想深入了解每个运算符的执行细节时,SQL 指标非常有用。 例如,“number of output rows” 可以回答 Filter 运算符之后输出了多少行,“shuffle bytes written total” 在 Exchange 运算符中显示了 shuffle 写入的字节数。
以下是 SQL 指标的列表
| SQL 指标 | 含义 | 运算符 |
|---|---|---|
number of output rows (输出行数) | the number of output rows of the operator (运算符的输出行数) | Aggregate operators, Join operators, Sample, Range, Scan operators, Filter, etc. (聚合运算符、连接运算符、采样、范围、扫描运算符、过滤器等) |
data size (数据大小) | the size of broadcast/shuffled/collected data of the operator (运算符广播/shuffle/收集的数据大小) | BroadcastExchange, ShuffleExchange, Subquery |
time to collect (收集时间) | the time spent on collecting data (收集数据所花费的时间) | BroadcastExchange, Subquery |
scan time (扫描时间) | the time spent on scanning data (扫描数据所花费的时间) | ColumnarBatchScan, FileSourceScan |
metadata time (元数据时间) | the time spent on getting metadata like number of partitions, number of files (获取元数据所花费的时间,例如分区数、文件数) | FileSourceScan |
shuffle bytes written (shuffle 写入的字节数) | the number of bytes written (写入的字节数) | CollectLimit, TakeOrderedAndProject, ShuffleExchange |
shuffle records written (shuffle 写入的记录数) | the number of records written (写入的记录数) | CollectLimit, TakeOrderedAndProject, ShuffleExchange |
shuffle write time (shuffle 写入时间) | the time spent on shuffle writing (shuffle 写入所花费的时间) | CollectLimit, TakeOrderedAndProject, ShuffleExchange |
remote blocks read (远程读取的块数) | the number of blocks read remotely (远程读取的块数) | CollectLimit, TakeOrderedAndProject, ShuffleExchange |
remote bytes read (远程读取的字节数) | the number of bytes read remotely (远程读取的字节数) | CollectLimit, TakeOrderedAndProject, ShuffleExchange |
remote bytes read to disk (从远程读取到磁盘的字节数) | the number of bytes read from remote to local disk (从远程读取到本地磁盘的字节数) | CollectLimit, TakeOrderedAndProject, ShuffleExchange |
local blocks read (本地读取的块数) | the number of blocks read locally (本地读取的块数) | CollectLimit, TakeOrderedAndProject, ShuffleExchange |
local bytes read (本地读取的字节数) | the number of bytes read locally (本地读取的字节数) | CollectLimit, TakeOrderedAndProject, ShuffleExchange |
fetch wait time (获取等待时间) | the time spent on fetching data (local and remote) (获取数据所花费的时间(本地和远程)) | CollectLimit, TakeOrderedAndProject, ShuffleExchange |
records read (读取的记录数) | the number of read records (读取的记录数) | CollectLimit, TakeOrderedAndProject, ShuffleExchange |
sort time (排序时间) | the time spent on sorting (排序所花费的时间) | Sort |
peak memory (峰值内存) | the peak memory usage in the operator (运算符中的峰值内存使用量) | Sort, HashAggregate |
spill size (溢出大小) | number of bytes spilled to disk from memory in the operator (运算符中从内存溢出到磁盘的字节数) | Sort, HashAggregate |
time in aggregation build (聚合构建中的时间) | the time spent on aggregation (聚合所花费的时间) | HashAggregate, ObjectHashAggregate |
avg hash probe bucket list iters (平均哈希探测桶列表迭代次数) | the average bucket list iterations per lookup during aggregation (聚合期间每次查找的平均桶列表迭代次数) | HashAggregate |
data size of build side (构建端的数据大小) | the size of built hash map (构建的哈希映射的大小) | ShuffledHashJoin |
time to build hash map (构建哈希映射的时间) | the time spent on building hash map (构建哈希映射所花费的时间) | ShuffledHashJoin |
task commit time (任务提交时间) | the time spent on committing the output of a task after the writes succeed (写入成功后,提交任务输出所花费的时间) | any write operation on a file-based table (对基于文件的表进行的任何写入操作) |
job commit time (作业提交时间) | the time spent on committing the output of a job after the writes succeed (写入成功后,提交作业输出所花费的时间) | any write operation on a file-based table (对基于文件的表进行的任何写入操作) |
data sent to Python workers (发送给 Python worker 的数据) | the number of bytes of serialized data sent to the Python workers (发送给 Python worker 的序列化数据字节数) | ArrowEvalPython, AggregateInPandas, BatchEvalPython, FlatMapGroupsInPandas, FlatMapsCoGroupsInPandas, FlatMapsCoGroupsInPandasWithState, MapInPandas, PythonMapInArrow, WindowsInPandas |
data returned from Python workers (从 Python worker 返回的数据) | the number of bytes of serialized data received back from the Python workers (从 Python worker 接收回的序列化数据字节数) | ArrowEvalPython, AggregateInPandas, BatchEvalPython, FlatMapGroupsInPandas, FlatMapsCoGroupsInPandas, FlatMapsCoGroupsInPandasWithState, MapInPandas, PythonMapInArrow, WindowsInPandas |
Structured Streaming 选项卡
当在微批处理模式下运行结构化流作业时,Web UI 上会显示一个结构化流选项卡。 概述页面显示有关正在运行和已完成的查询的一些简要统计信息。 此外,您可以检查失败查询的最新异常。 有关详细统计信息,请点击表格中的“run id”。

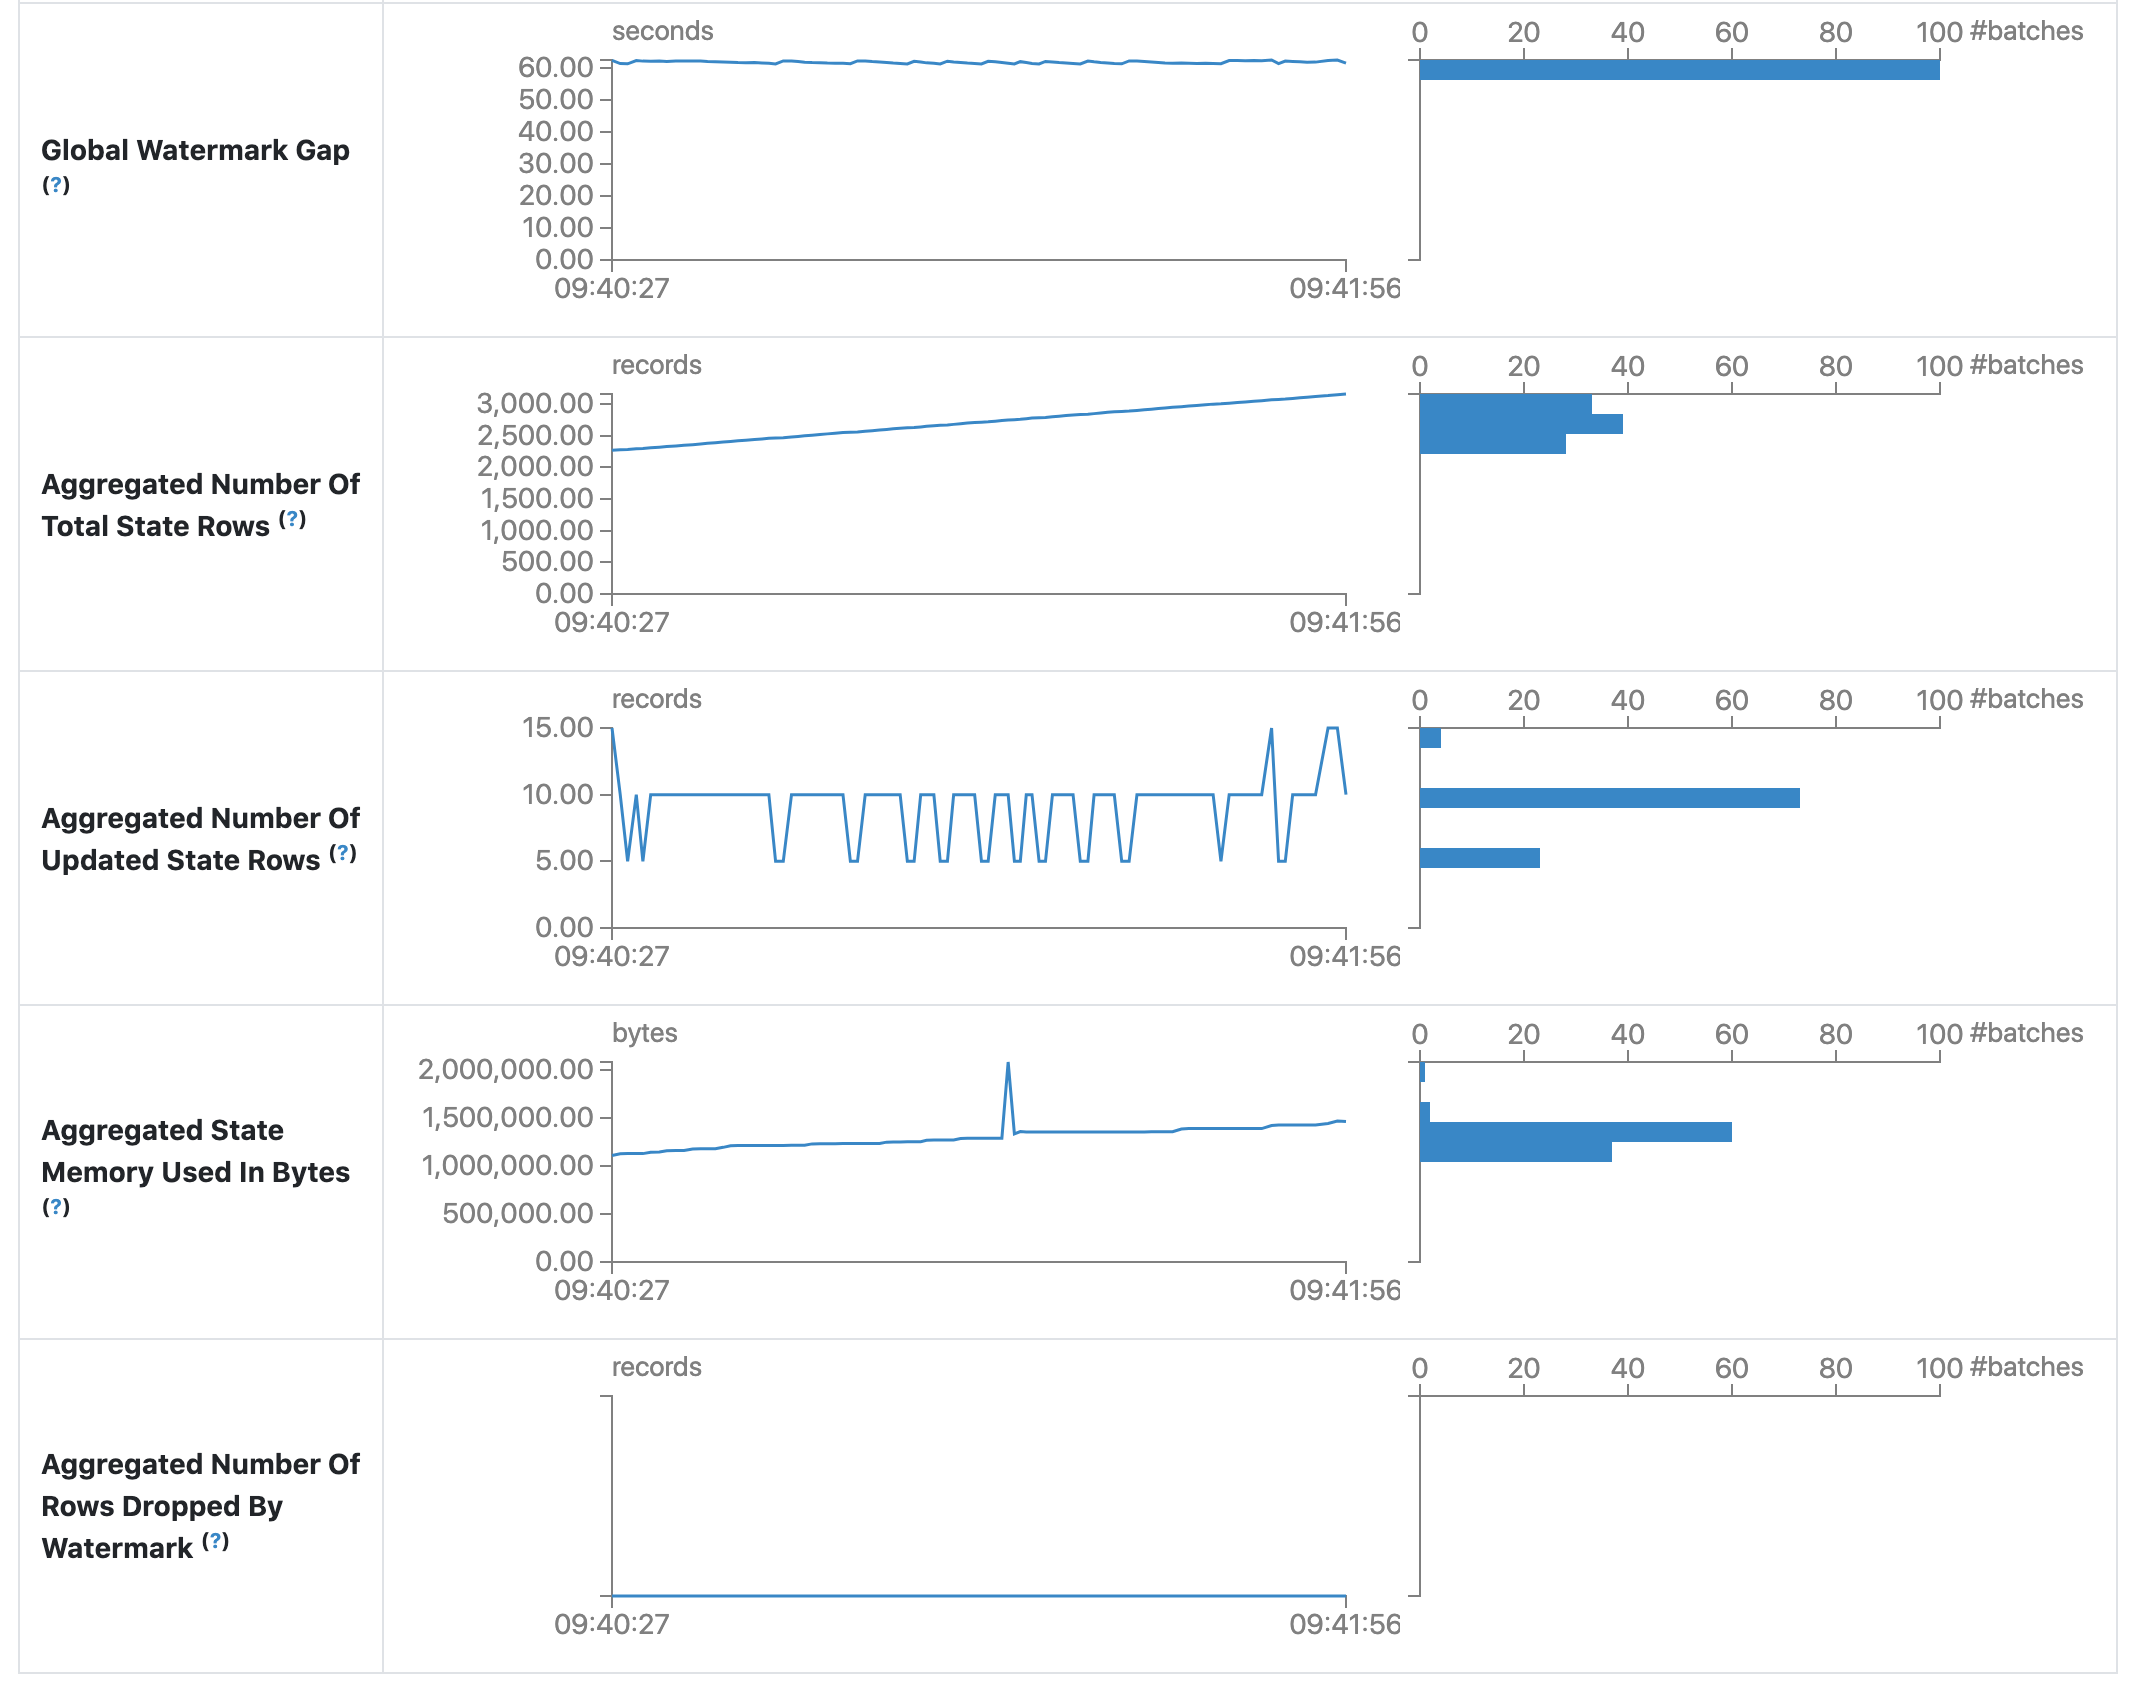
统计信息页面显示了一些有用的指标,可用于深入了解流式查询的状态。 目前,它包含以下指标。
- Input Rate (输入速率)。 数据到达的总速率(跨所有源)。
- Process Rate (处理速率)。 Spark 处理数据的总速率(跨所有源)。
- Input Rows (输入行数)。 在触发器中处理的记录总数(跨所有源)。
- Batch Duration (批处理持续时间)。 每个批处理的处理持续时间。
- Operation Duration (操作持续时间)。 执行各种操作所花费的时间(以毫秒为单位)。 跟踪的操作如下所示。
- addBatch: 从源读取微批处理的输入数据、处理它以及将批处理的输出写入到接收器所花费的时间。 这应该占用微批处理的大部分时间。
- getBatch: 准备逻辑查询以从源读取当前微批处理的输入所花费的时间。
- latestOffset & getOffset: 查询此源的最大可用偏移量所花费的时间。
- queryPlanning: 生成执行计划所花费的时间。
- walCommit: 将偏移量写入元数据日志所花费的时间。
- Global Watermark Gap (全局水印间隔)。 批处理时间戳和批处理的全局水印之间的间隔。
- Aggregated Number Of Total State Rows (总状态行数的聚合)。 总状态行数的聚合。
- Aggregated Number Of Updated State Rows (已更新状态行数的聚合)。 已更新状态行数的聚合。
- Aggregated State Memory Used In Bytes (状态内存使用的聚合(以字节为单位))。 状态内存使用的聚合(以字节为单位)。
- Aggregated Number Of State Rows Dropped By Watermark (被水印删除的状态行数的聚合)。 被水印删除的状态行数的聚合。
作为早期版本,统计信息页面仍在开发中,并在未来的版本中会进行改进。
Streaming (DStreams) 选项卡
如果应用程序使用带有 DStream API 的 Spark Streaming,则 Web UI 会包含一个 Streaming 选项卡。 此选项卡显示数据流中每个微批处理的调度延迟和处理时间,这对于对流式应用程序进行故障排除非常有用。
JDBC/ODBC Server 选项卡
当 Spark 作为 分布式 SQL 引擎运行时,我们可以看到此选项卡。 它显示有关会话和提交的 SQL 操作的信息。
页面的第一部分显示有关 JDBC/ODBC 服务器的一般信息:启动时间和运行时间。

第二部分包含有关活动和已完成会话的信息。
- 连接的 User (用户) 和 IP (IP地址)。
- Session id (会话 ID) 链接以访问会话信息。
- 会话的 Start time (开始时间)、finish time (结束时间) 和 duration (持续时间)。
- Total execute (总执行次数) 是在此会话中提交的操作数。

第三部分包含提交的操作的 SQL 统计信息。
- 提交操作的 User (用户)。
- 指向 jobs tab (作业选项卡) 的 Job id (作业 ID) 链接。
- 将所有作业分组在一起的查询的 Group id (组 ID)。 应用程序可以使用此组 ID 取消所有正在运行的作业。
- 操作的 Start time (开始时间)。
- 获取结果之前的执行 Finish time (结束时间)。
- 获取结果后操作的 Close time (关闭时间)。
- Execution time (执行时间) 是结束时间和开始时间之间的差。
- Duration time (持续时间) 是关闭时间和开始时间之间的差。
- Statement (语句) 是正在执行的操作。
- 流程的 State (状态)。
- Started (已启动),第一个状态,当流程开始时。
- Compiled (已编译),生成执行计划。
- Failed (失败),最终状态,当执行失败或以错误结束时。
- Canceled (已取消),最终状态,当执行被取消时。
- Finished (已完成) 处理并等待获取结果。
- Closed (已关闭),最终状态,当客户端关闭语句时。
- Detail (详细信息) 包含解析的逻辑计划、分析的逻辑计划、优化的逻辑计划和物理计划,或者 SQL 语句中的错误。
